VENIONAIRE DEALMATRIX MULTIPLES
Valuation Multiples for
Private Markets
Private market EV/Sales & EV/EBITDA multiples, tailored by sector, stage, and region.
TRACK RECORD OF LEADING COMPANIES & EVENTS


BENEFITS
The private equity/venture capital multiples gap — closed.
A smarter way to benchmark valuations of private companies.
Granular Coverage
Breakdown by Sector, Stage & Region
Sector, stage, and region filters for context-specific multiples.
Weight Assignment
Precise Weight Assignment
Assign weights across sectors and generate a weighted average multiple tailored to your deal.
Time-Series-Based
Time-Series-Based
You can compare private-company EV/Sales and EV/EBITDA multiples over a time series of 20 years.
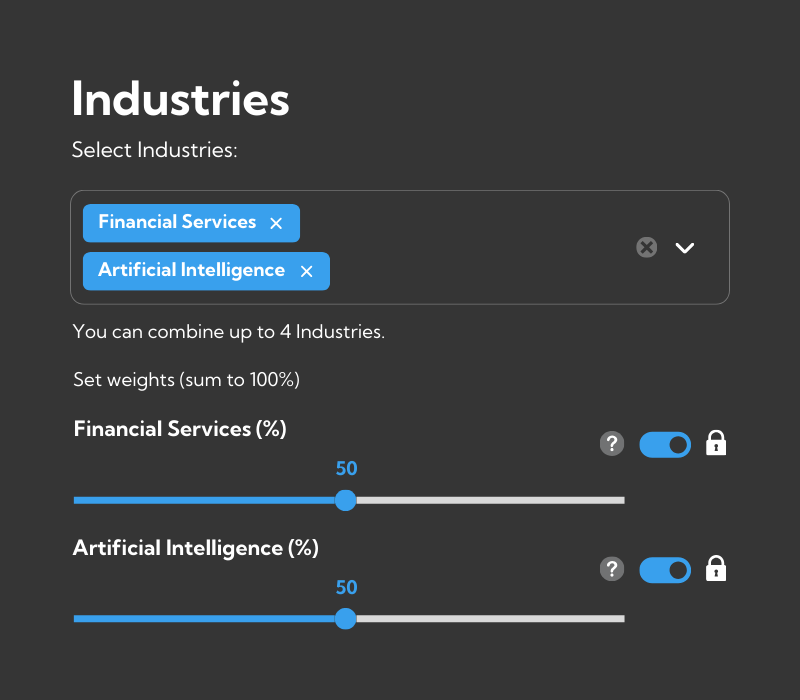
Select your sector & assign weights.
Choose your sector focus and apply custom weights to build a multiple that reflects your specific deal.
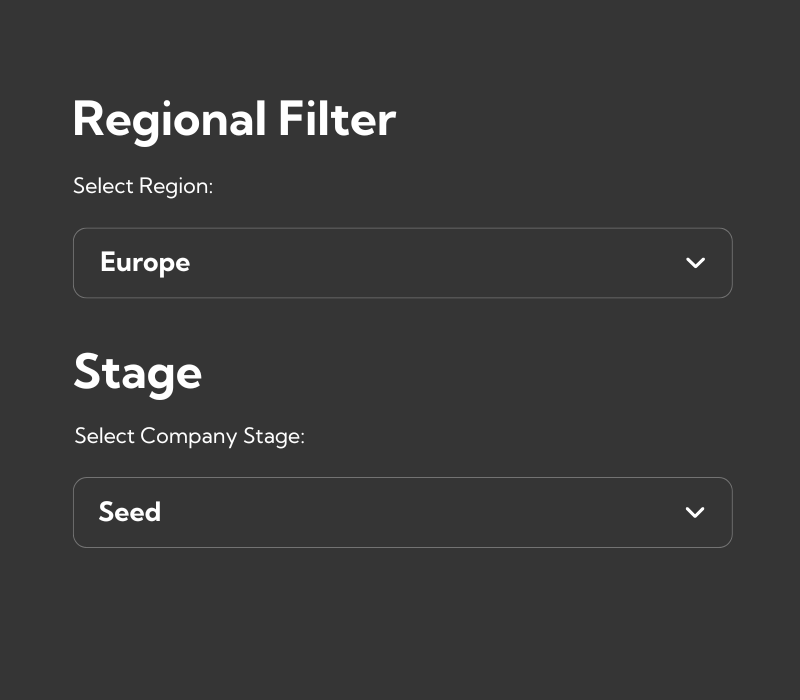
Select your region & stage.
Select the region and company stage to get multiples tailored to the exact market context you’re analyzing.
Receive and download multiples.
Download your tailored private multiples in one click.
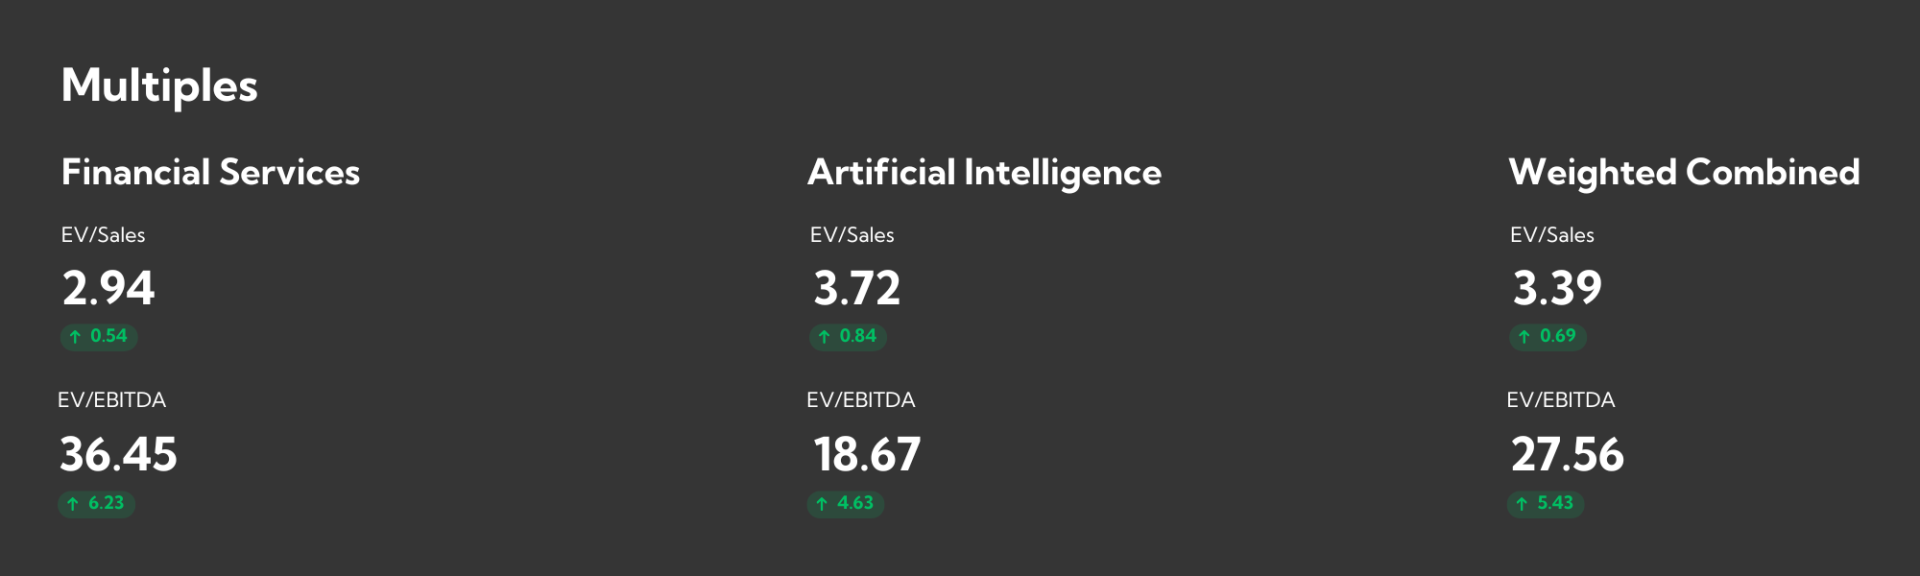
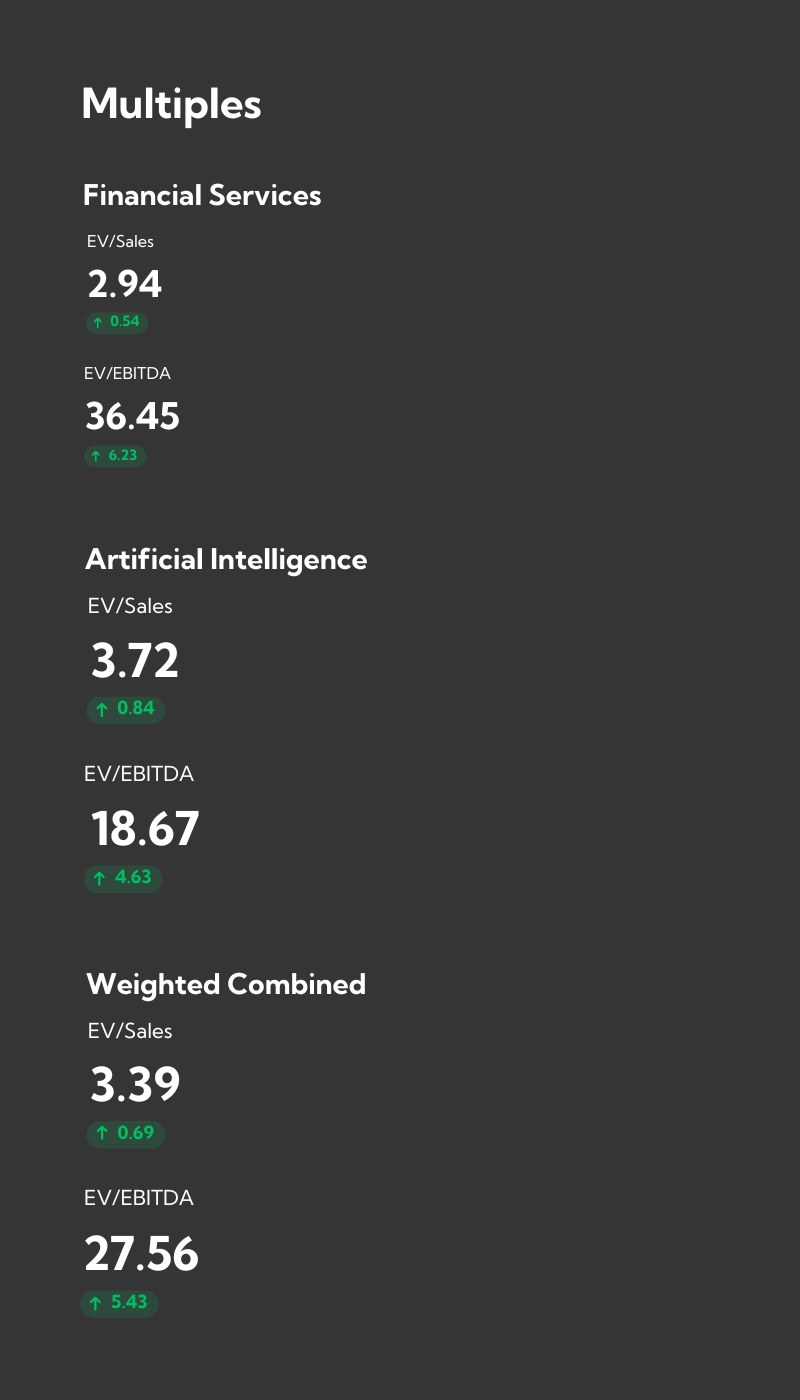
*illustration purposes only
TRUSTED PARTNER
This is why analysts rely on us.
Confidence built into every multiple we deliver.
Robust Analytical Framework
Our proprietary engine is trained using our internal research and data and also integrates market-based valuation metrics with macroeconomic indicators, reflecting not only sector-specific trends but also the underlying economic context influencing the private equity landscape.
Trusted Data Sources
We base our analysis on internationally recognized financial and macroeconomic datasets, ensuring that all inputs come from reliable and authoritative institutions.
Quality Assurance
Outlier detection and systematic adjustments are applied to enhance consistency and reduce statistical distortions, ensuring that the results remain practical and applicable across diverse contexts.
The Venionaire DealMatrix Multiples Model
DealMatrix multiples are derived through a six-step model combining public capital market comparables, proprietary VC/PE/M&A transaction data, and macroeconomic indicators.
The model produces three components: The reported public multiple, the model-predicted multiple, and the lower bound predicted multiple averaged into the DealMatrix Composite, then adjusted for region and funding stage. The methodology follows the IPEV Guidelines 2025.
FAQ
The most asked questions answered here.
Where is the data coming from?
DealMatrix multiples start from roughly 200 GICS-classified public equity indices across six regions and 25 years of quarterly history. Several steps then turn this baseline into private-market multiples: a mixed linear model with eight macroeconomic factors, a regional adjustment, a mapping of the indices onto approximately 150 private-market startup categories (SaaS, marketplaces, AI infrastructure and more), and a funding-stage adjustment from Pre-Seed to Series E. The tool provides private-market multiples across 140+ sectors, each modelled independently by sector, stage and region, aligned with the IPEV Guidelines 2025.
How do you select and curate the data?
DealMatrix multiples are produced through a six-step econometric model:
- Data acquisition. Roughly 200 GICS-classified public equity indices per region and quarter form the observable baseline.
- Statistical cleaning. Unusable records are removed, observations are aggregated at subsector level, and extreme values are capped (300x for EV/EBITDA, 60x for EV/Sales).
- Econometric modelling. The panel is combined with eight quarterly macroeconomic indicators per region (GDP, interest rates, inflation, money supply); a mixed linear model separates macro, sector, time and region effects, and a reported multiple, a model-predicted fair value and a conservative lower bound are averaged into one stable figure.
- Regional adjustment. A coefficient normalised to North America reflects differences in market depth, investor appetite and valuation culture.
- Industry weighting. Because startups rarely map to a single listed sub-industry, each of roughly 150 DealMatrix categories is a weighted blend of the public sub-industries whose companies are most economically comparable.
- Stage adjustment. A stage factor from Pre-Seed to Series E adds an early-stage growth premium and a late-stage pre-IPO discount, producing true private-market multiples.
The methodology follows the IPEV Guidelines 2025.
How do you ensure data accuracy?
Accuracy is built in at every layer:
- Institutional-grade public equity and macroeconomic inputs.
- Cleaning and normalisation (removal of unusable records, subsector aggregation, outlier capping) to reduce statistical noise.
- A mixed linear model that separates macroeconomic, sector, time and region effects, then averages a reported multiple, a model-predicted fair value and a conservative lower bound into one stable figure.
- Every sector, stage and region combination modelled independently (around 49,000 data points), refreshed quarterly.
The output complies with the IPEV Guidelines 2025.
How wide is the coverage?
Coverage is granular and modelled independently for each combination:
- 140+ private-market sectors, mapped from roughly 200 GICS-classified public indices.
- 7 funding stages, Pre-Seed to Series E.
- 6 global regions (Europe, North America, APAC and more).
- 25 years of quarterly history, both EV/Sales and EV/EBITDA.
Around 49,000 sector-stage-region data points, updated each quarter.
Why use the Multiples App by Venionaire DealMatrix?
You get private-market multiples calibrated to how startups are valued at each funding stage, sector and region. Roughly 200 public equity indices are mapped onto approximately 150 private-market startup categories and adjusted by region and by funding stage (Pre-Seed to Series E), adding an early-stage growth premium and a late-stage pre-IPO discount. A six-step econometric model over 25 years of data, refreshed quarterly and aligned with the IPEV Guidelines 2025, delivers market-realistic private-market valuation ranges by sector, stage and region.
- 15,000+ PE/VC multiples
- 140+ Industries
- EV/Sales & EV/EBITDA multiples
- 6 Regions & 7 Stages filter
- Up to 25 years of time series
- Individual sector weighting
- PDF export
- Up to 3 Workspaces
- 15,000+ PE/VC multiples
- 140+ Industries
- EV/Sales & EV/EBITDA multiples
- 6 Regions & 7 Stages filter
- Up to 25 years of time series
- Individual sector weighting
- PDF export
- Unlimited Workspaces
- Raw data export (CSV / Excel)
- Priority support
- Everything in Professional, plus:
- API Access
- Individual Branding
- Custom Reports
- Premium Support
- Individual Contingent